What Is Quantitative Tightening?
It’s the opposite of “quantitative easing!” When the Federal reserve was buying treasury and agency securities, they were increasing the size of their balance sheet. At the end of September 2017, the balance sheet totaled $4.5 trillion. The unwinding of the balance sheet began in October 2017 and is called “quantitative tightening.” Easing adds money into the banking system, tightening drains money from the banking system.
The “quantitative tightening” schedule currently calls for a drain of $35 billion per month May through September. This would total an additional unwinding of $175 billion. The current balance sheet was last marked on May 8 at $3.892, up $3 billion from $3.889 trillion on May 1. This increase was likely caused by U.S. Treasury maturities on April 30 that exceeded the unwinding guideline. The New York Federal Reserve Open Market Trading Desk probably bought $3 billion of longer maturity Treasuries from the Primary Dealer community.
The Financial Select Sector SPDR ETF (XLF) has been ignoring quantitative tightening.
The Daily Chart for XLF
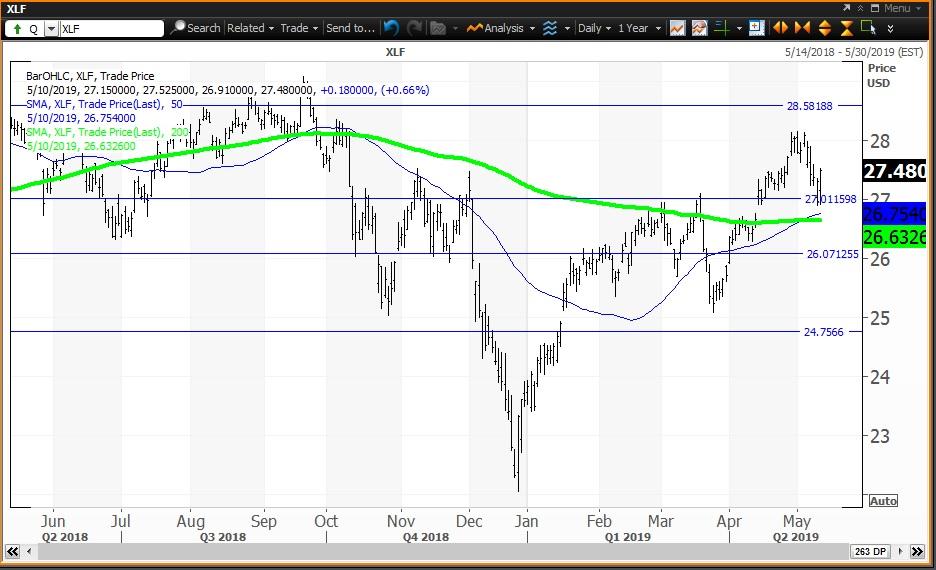 Courtesy of Refinitiv XENITH
The daily chart for XLF shows that the ETF confirmed a “golden cross” on May 6 when the 50-day simple moving average at $26.75 rose above the 200-day simple moving average at $26.63, indicating that higher prices lie ahead. This makes weakness to the 200-day a buying opportunity. The ETF traded as low as $22.05 on Dec. 26 and closed that day at $23.32 above the Dec. 24 high of $22.75 as a “key reversal.” The Dec. 31 close of $23.82 was an important input to my proprietary analytics and its semiannual and annual pivots at $26.09 and $27.01, respectively. The close of $25.71 on March 29 was input to my analytics and resulted in the quarterly risky level at $28.59. The close of $28.02 on April 30 resulted in a monthly value level for May at $24.75.
The Weekly Chart for XLF
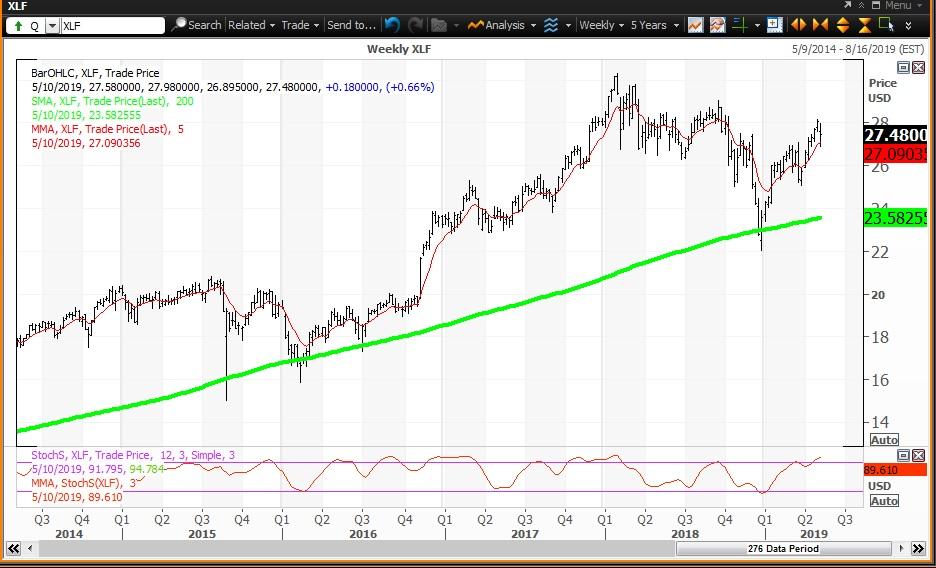 Courtesy of Refinitiv XENITH
The weekly chart for XLF is positive but overbought, with the ETF above its five-week moving average at $27.09. The ETF is above its 200-week simple moving average or “reversion to the yield” at $23.58 which held at the beginning of the year at $22.97. The 12x3x3 weekly slow stochastic reading rose to 89.61 last week, up from 88.52 on May 3. If this reading rises above 90.00, XLF becomes an “inflating parabolic bubble.”
Trading Strategy: Buy weakness to the 200-day simple moving average at $26.63 and to its semiannual value level at $26.09 and reduce holdings on strength to the quarterly risky level at $28.59. My annual pivot remains at $27.01.
How to use my value levels and risky levels:
Value levels and risky levels are based upon the last nine weekly, monthly, quarterly, semiannual and annual closes. The first set of levels was based upon the closes on Dec. 31. The original semiannual and annual levels remain in play. The weekly level changes each week; the monthly level was changed at the end of January, February, March and April. The quarterly level was changed at the end of March. My theory is that nine years of volatility between closes are enough to assume that all possible bullish or bearish events for the stock are factored in. To capture share price volatility, investors should buy on weakness to a value level and reduce holdings on strength to a risky level. A pivot is a value level or risky level that was violated within its time horizon. Pivots act as magnets that have a high probability of being tested again before its time horizon expires.
How to use 12x3x3 Weekly Slow Stochastic Readings:
My choice of using 12x3x3 weekly slow stochastic readings was based upon back-testing many methods of reading share-price momentum with the objective of finding the combination that resulted in the fewest false signals. I did this following the stock market crash of 1987, so I have been happy with the results for more than 30 years. The stochastic reading covers the last 12 weeks of highs, lows and closes for the stock. There is a raw calculation of the differences between the highest high and lowest low versus the closes. These levels are modified to a fast reading and a slow reading and I found that the slow reading worked the best. The stochastic reading scales between 00.00 and 100.00 with readings above 80.00 considered overbought and readings below 20.00 considered oversold. Recently, I noted that stocks tend to peak and decline 10% to 20% and more shortly after a reading rises above 90.00, so I call that an “inflating parabolic bubble” as a bubble always pops. I also call a reading below 10.00 as being “too cheap to ignore.”
Disclosure: I/we have no positions in any stocks mentioned, and no plans to initiate any positions within the next 72 hours. I wrote this article myself, and it expresses my own opinions. I am not receiving compensation for it (other than from Seeking Alpha). I have no business relationship with any company whose stock is mentioned in this article.
via https://www.aiupnow.com
, Khareem Sudlow

