How quickly a web page loads and becomes interactive is closely related to user experience and conversions, and thus sales and profit.
Site performance is critical for three reasons: the increase in mobile web usage, Google’s emphasis on page speed as a search ranking criteria, and consumer expectations.
As an example, an often-cited 2017 report from Akamai (PDF), found that:
- “Just a 100-millisecond delay in load time hurts conversion rates by up to 7 percent.”
- “A two-second delay in load time hurts bounce rates by up to 103 percent.”
- And, “a two-second delay correlated with up to a 51-percent decrease in session length.”
In a February 2019 article, Mary Ellen Coe, president of Google’s Global Customer Solutions, referred to this same Akamai report and others when she wrote, “54 percent of people say that as the load time for a brand’s mobile site increases, so does their frustration. And that affects the bottom line. In retail, we’ve seen that a one-second delay in mobile load times can impact conversion rates by up to 20 percent.”
“This presents any business that has a mobile presence with a simple choice: either provide customers the kind of mobile experience they expect or be prepared to watch those customers go elsewhere — and fast.”
The first step, however, is knowing your site’s current performance and what might be impacting its speed.
Google has three helpful testing tools to understand how well a website is performing and, also, how to improve it.
Lighthouse in Chrome
Lighthouse is an open-source site testing tool included with Google Chrome. You can visit any website, open the Chrome developer tools, and run a site audit from the “Lighthouse” tab. It is a good idea, however, to run Lighthouse with Chrome in incognito mode, so that no Chrome extensions interfere with the performance test.
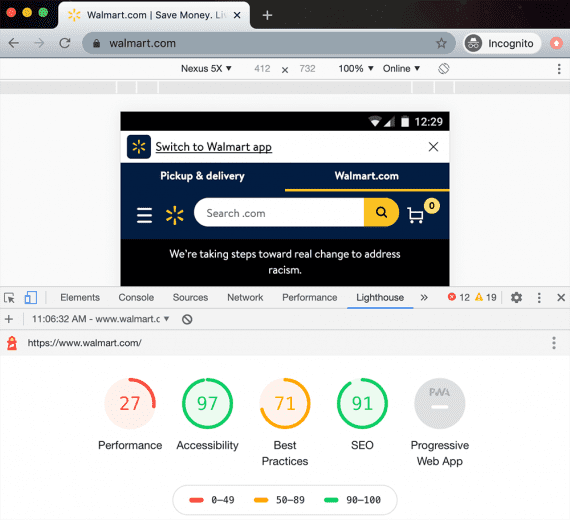
Lighthouse comes with Google Chrome and can easily be run from within the browser, such as this test for Walmart.com.
This is the same tool that contributor Hamlet Batista references in “Assessing Google’s ‘Core Web Vitals’ on Shopify Themes,” and “Page Speed Scores of Every Shopify Theme.” Taking a look at how he compared Shopify themes is a helpful way to understand just what Lighthouse can do for your company.
Perhaps the best thing about the Lighthouse tool is that it offers specific performance recommendations. A small business owner, for example, could ask her developer to get the Lighthouse performance score to 90 or above, without having to understand all of the associated technical issues.
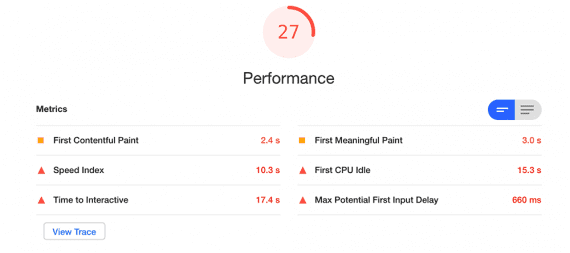
In Chrome, Lighthouse makes specific recommendations for improving a website’s performance.
Test My Site
Think with Google, a resource site to share research and insights, includes a free “Test My Site” tool. It provides similar results as Lighthouse and may even rely on it.
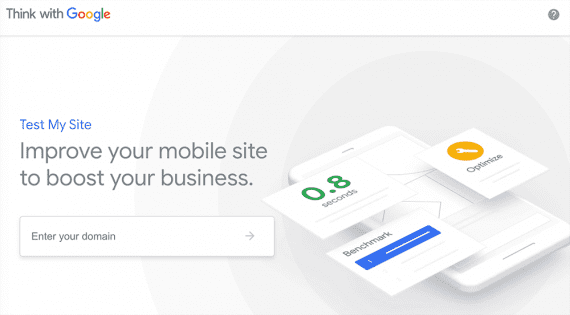
Test My Site is another easy-to-use performance testing tool. It provides similar results as Lighthouse.
Test My Site focuses on mobile site speed and user experience, and it has several compelling features.
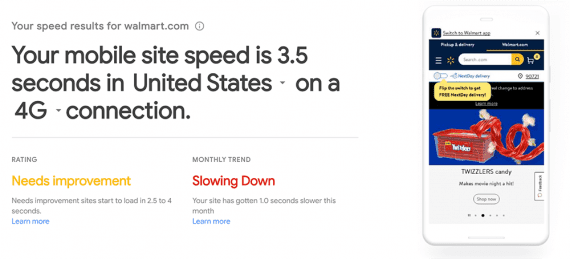
This is an example Test My Site report for Walmart.com.
For example, when Test My Site makes speed-improvement recommendations, it first displays “high impact” changes to help prioritize.
Almost all of the tool’s recommendations include links that explain in detail the recommendations or solutions.
The Test My Site tool allows you to compare your site’s performance to leading competitors. Enter a competitor’s URL and see a load time result. The tool is also helpful for benchmarking your site against industry peers.
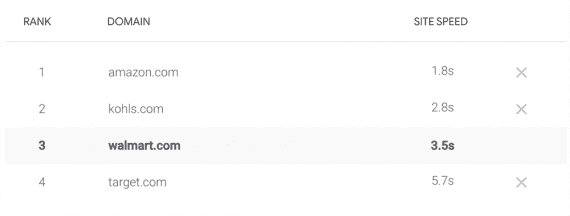
Test My Site lets you compare your website’s speed to a set of competitors, such as this example with Amazon.com, Kols.com, Walmart.com, and Target.com.
Test My Site also offers an incentive to improve with its return-on-investment evaluator. Enter your site’s number of average monthly visitors, an average conversion rate, and an average order value. The tool estimates how much more revenue your business would generate with a faster site. While it is likely very rough, the estimate is certainly interesting.
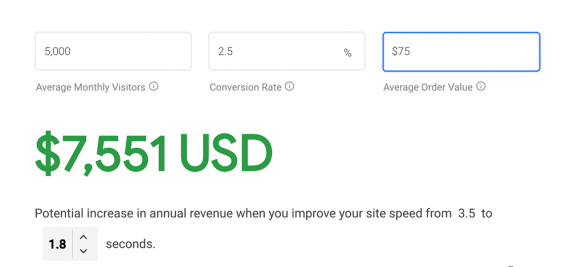
Want to know how much site performance is impacting revenue? Test My Site offers an estimate.
Advanced Lighthouse
The same Lighthouse audit tool available in Google Chrome can also be accessed (i) from a command line, (ii) via a Node.js module, or (iii) as part of a continuous integration workflow.
While they require more technical expertise, these Lighthouse options can be powerful to conduct site performance audits, including automated ones.
Lighthouse Command Line Interface (CLI). The first of these “advanced” uses allows you to run Lighthouse from a terminal. You will need Google Chrome loaded on your computer. But otherwise, once it is installed, type the following to generate a report for Walmart’s website, for example.
lighthouse https://walmart.com
In this example, the tool will open the audit report in Chrome.
You can also pass parameters to change the output to receive the audit as a comma-separated-value (CSV) file or in JavaScript Object Notation (JSON). This example would return JSON:
lighthouse https://walmart.com ---output json --output-path <path/for/output.json>
A developer familiar with writing command-line applications or batch files could use the Lighthouse CLI to automate audits, perhaps, running them on a schedule.
Lighthouse Node Module. Lighthouse can also be used programmatically via a Node.js module, making it available to many, if not most, modern web development projects. The tool could run on a schedule, and output to a file or database for on-going analysis.
Lighthouse CI. For sites using continuous integration, Lighthouse CI can become part of the development workflow, automatically testing the site’s performance each time new code is checked in.
Choosing Your Tests
Google offers three excellent site performance testing options: Lighthouse in Chrome, Test My Site, and other advanced versions of Lighthouse.
To be sure, not every developer or marketer likes how these tests work or what they recommend. But in my experience, the tools can help understand how your site is performing and how that performance could be impacting your business’s bottom line.
June 24, 2020 at 07:42AM
via https//www.brucedayne.com/
Armando Roggio, Khareem Sudlow
