
Want to know how your SEO efforts are paying off?
Google provides a free tool called Google Search Console that provides a ton of detailed information about your site’s performance, security issues, errors, and more.
How does it work? That’s what we’re going to cover today.
What is Google Search Console?
Google Search Console is a suite of tools from Google that helps you track your site’s performance, find issues, and help your site rank higher in Google. It is a powerful, but complex, tool.
Back in 2010, we wrote a thorough beginner’s guide to Google Webmaster Tools. Since then, there have been significant changes to Google Webmaster Tools, including a rebranding as Google Search Console.
We’ve updated this guide to include how to set up Google Search Console, what data you’ll find about your website, important data you might have forgotten about, and how to continually monitor for any issues that might affect your search engine rankings.
How to Set Up Google Search Console
If you haven’t already, the first thing you will need to do is set up your website with Google Search Console.
To do this, visit the Search Console website, sign in with your Google Account – preferably the one you are already using for Google Analytics.
Click the Add Property button in the upper left corner, and you’ll see this dialogue box:
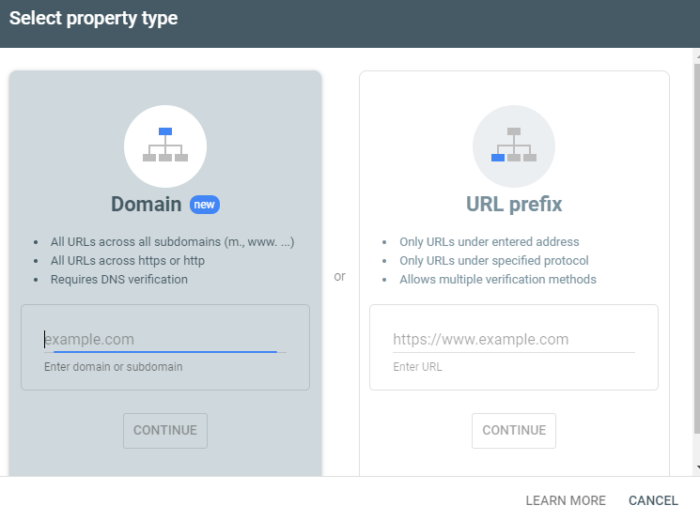
Select the URL prefix, as it gives you more options for verification.
Next, you will have to verify this site as yours.
Previously, this involved having to embed code into your website header or upload an HTML file to your web server.
Now, if you already have Google Analytics, it will automatically verify your site for you and you will see this:
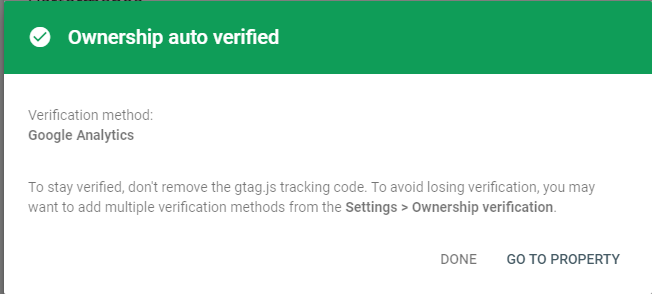
If this doesn’t work for you, use one of these other options for verification.
Once your site is verified, you will want to submit a sitemap if you have one available.
This is a simple XML file that will tell Google Search Console what pages you have on your website
If you have one already, you can usually find it by typing in http://yourdomain.com/sitemap.xml to see it in your browser.
To create a sitemap if you don’t already have one, you can use online tools like XML Sitemaps.
If you are running a website on your own domain using WordPress, you can install the Google XML Sitemaps plugin.
Once you have activated the plugin, look under your Settings in the WordPress dashboard and click on XML-Sitemap.
The plugin should have already generated your sitemap, so there’s nothing else you have to do.
You’ll find your URL at the very top of the page:
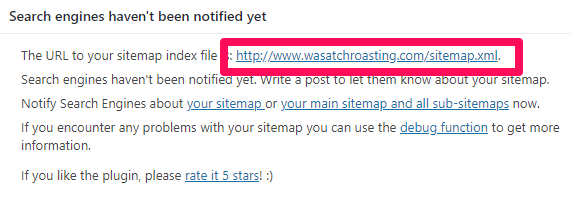
Copy the link address and head back over to Google Search console, then paste it under “Add a new site map” in GSC.

It may take a few days for Search Console to start pulling information about your website.
Be sure to wait a bit, then keep reading to find out what else you can learn from Google Search Console!
What Data Can You Pull From Google Search Console?
Once you’ve added and verified your website, you’ll be able to see tons of information about your site performance in GSC.
Remember, this is a powerful tool; these are only the highlights of new types of data and the important data you should remember to check on occasionally.
Google Search Console Overview
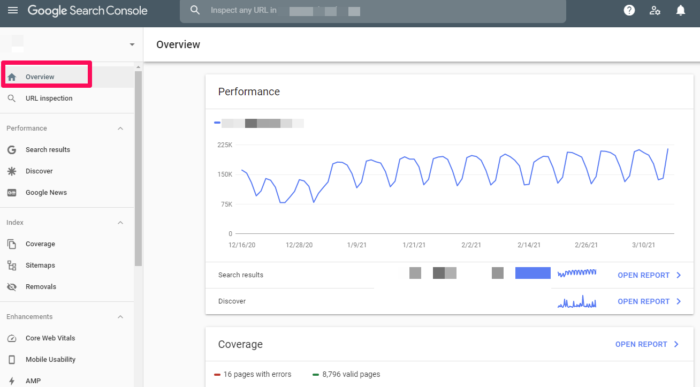
When you visit your website in GSC, you will first see your Overview.
This is an overview of the important data within Google Search Console. You can visit specific areas such as your Crawl Errors, Search Analytics, and Sitemaps from this screen by clicking on the applicable links.
You can also navigate to these areas using the menu in the left sidebar.
Search Results
In the left sidebar, you’ll see is Search Results.
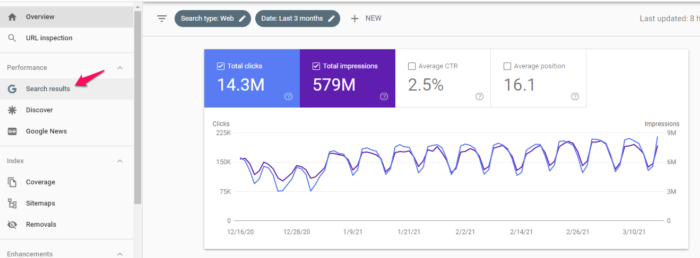
This section gives you an overview of how your site appears in the Search Engine Results Page, including total clicks, impressions, position, click-through rate, and what queries your site shows up for.
The filters at the top allow you to sort data based on location, date, type of search, and much more. This data is crucial to understanding the impact of your SEO efforts.
Index Coverage Report
This report gives you data about the URLs that Google has tried to index on your selected property and any problems Google has had.
As Googlebot crawls the Internet, it processes each page it comes across to compile an index of every word it sees on every page.
It also looks at content tags and attributes like your Titles or alt texts.
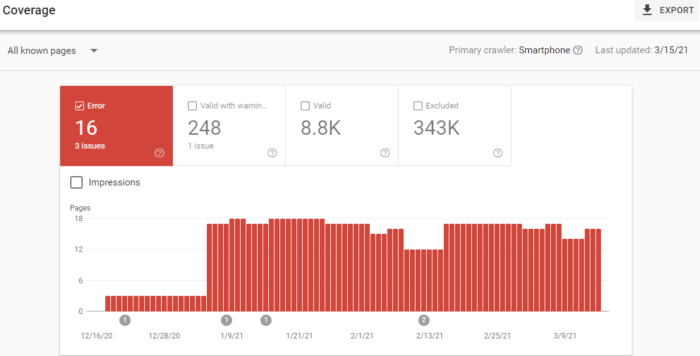
This graph shows a breakdown of the URLs on your site that have been indexed by Google and can thus appear in search results.
As you add and remove pages, this graph will change with you.
Don’t worry too much if you have a smaller number of indexed pages than you think you should. Googlebot filters out the URLs it sees as a duplicate, non-canonical, or those with a no index meta tag.
You’ll also notice a number of URLs that have been disallowed from crawling by your robots.txt file.
And you can also check on how many URLs you’ve removed with the Removal Tool. This will most likely always be a low value.
Sitemaps
I mentioned sitemaps earlier, so I’ll cover this again in brief.
In GSC under “Sitemaps,” you will see information about your sitemap, including if you have one and when it was last updated.
If you notice the last date your sitemap was downloaded is not recent, you might want to submit your sitemap to refresh the number of URLs submitted.
Otherwise, this helps you keep track of how Google is reading your sitemap and whether or not all of your pages are viewed as you want them to be.
Removals
If for some reason you need to temporarily block a page from Google’s search results, head to removals.
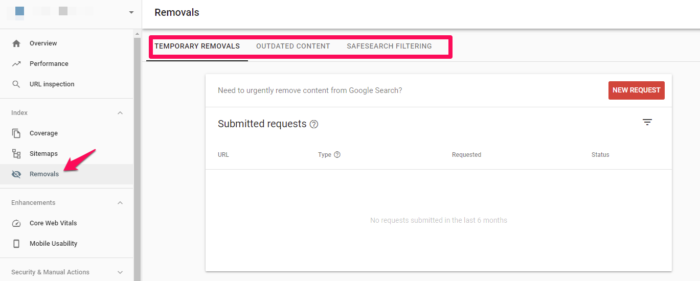
You can hide a page for approximately 90 days before this wears off.
If you want to permanently remove a page from Google’s crawling, you’ll have to do it on your actual website.
Core Website Vitals
Core website vitals are a set of metrics that impact your search ranking. They include speed, usability, and visual stability. These are now ranking signals, so you’ll want to pay attention to them.
Accelerated Mobile Pages (AMP)
Accelerated Mobile Pages is an open-source initiative designed to provide fast-loading mobile websites that work with slow connection speeds.
You can go here to get started creating your first page if you haven’t got one already.
You’ll be given a boilerplate piece of coding that you can customize to your site.
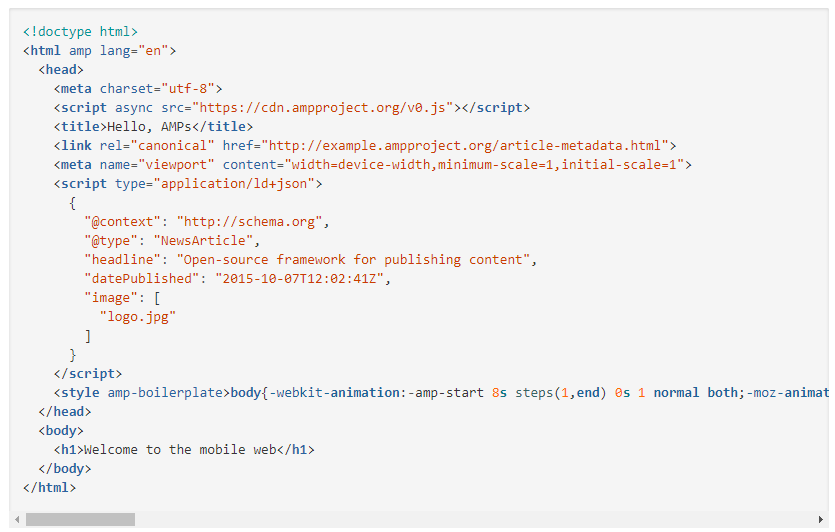
To view pages in GSC, head to Enhancements > AMP.
Links to Your Site
Curious about your backlinks?
GSC shows you the domains that link to you the most as well as the pages on your website with the most links. Scroll down in the left side bar until you see “links.” Click and you’ll see a full report of links to your site:
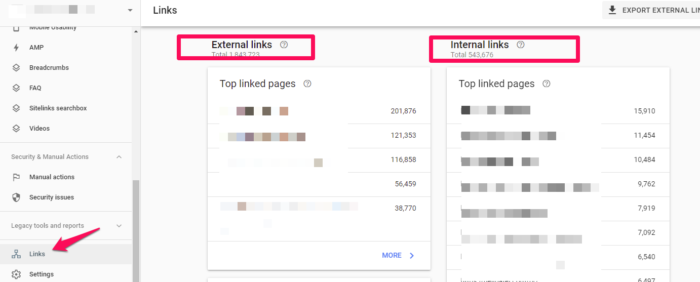
This is probably the most comprehensive listing of your backlinks (and internal links!) that you will find, for free at least.
It’s a powerful tool to know where your content is being leveraged around the web, and what performs best in Google’s eyes.
Manual Actions
The Manual Actions tab is where you can find out if any of your pages are not compliant with Google’s webmaster quality guidelines.
It’s one of the ways that Google has taken action against web spamming.
Mobile Usability
On the Mobile Usability tab, you can check to make sure that all of your website’s pages are aligned with what Google considers best practice.
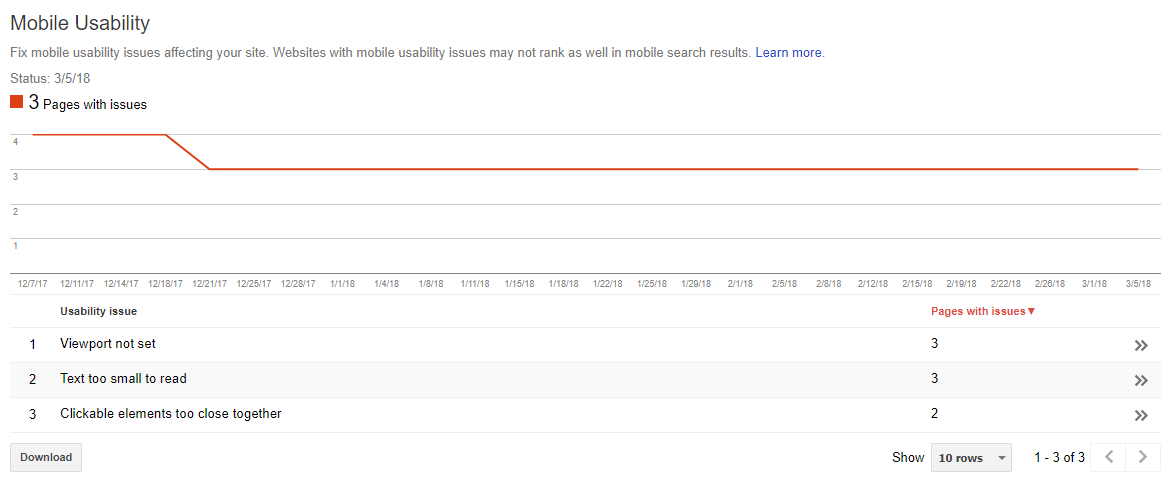
As you can see, you can have issues with text size, viewport settings, or even the proximity of your clickable elements.
Any of these problems, as well as other errors, can negatively affect your mobile site’s rankings and push you lower on the results page. Finding and fixing these errors will help your user experience and results.
While reviewing this information, I suggest that you also check your site’s mobile speed. I use Ubersuggest to do so.
The first thing you want to do is type your URL into the search box and click “Search.”
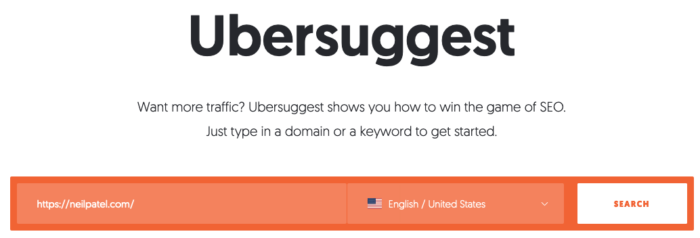
After clicking the “Search” button, click “Site Audit” in the left sidebar and then scroll down the page until you seed “Site Speed.”
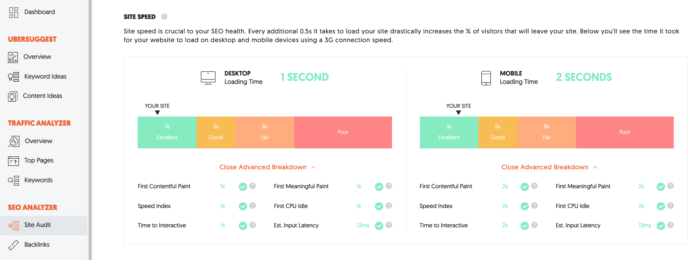
You’ll see the site speed for both desktop and mobile devices. For the sake of this exercise, we’re more interested in mobile loading time. My site loads on mobile devices in two seconds, which scores in the excellent range.
In addition to overall site speed, there’s also an advanced breakdown for:
- First contentful paint
- Speed index
- Time to interactive
- First meaningful paint
- First CPU idle
- Estimated input latency
If you see any issues here, fix them immediately, and then re-test your site. It may be enough to improve your loading time.
Crawl Stats
For a more in-depth analysis of how often Googlebot is looking at your site, you can use the Crawl Stats report under Settings > Crawl stats.
Here, you’ll see how often the pages of your site are crawled, how many kilobytes are downloaded per day, and what the download times of your site are.
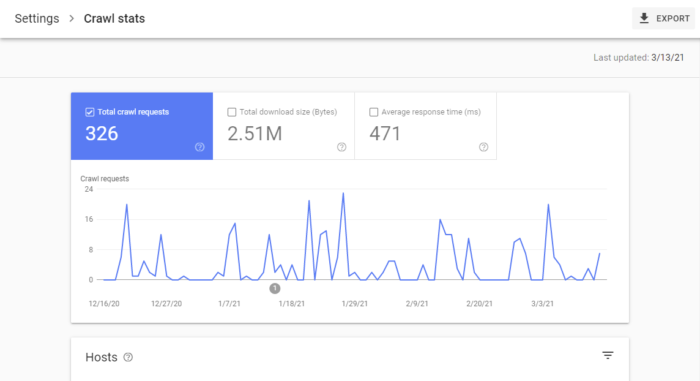

According to Google, there is no “good” crawl number, but they do have advice for any sudden spikes or drops in your crawl rates.
Fetch as Google (Now Called URL Inspection)
This tool is helpful as it lets actually do a test run of how Google crawls and renders a specific URL on your site.
It’s a helpful way to make sure that Googlebot can access a page that might otherwise be left to guesswork.
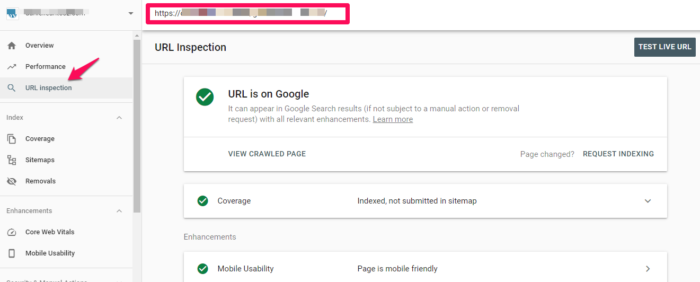
If you’re successful, the page will render, and you’ll be able to see if any resources are blocked to Googlebot.
If you want access to the code of your site, click “View Tested Page” to see the HTML, a screenshot, and any crawl errors. (Note: Crawl errors used to be its own report, now it’s located in URL inspection under “Coverage.”)
When you get to the debugging point of web development, you can’t beat this free tool.
Robots.txt Tester
If you’re using a robot.txt file to block Google’s crawlers from a specific resource, this tool allows you to double-check that everything is working.
So if you have an image you don’t want to appear in a Google Image Search, you can test your robot.txt here to make sure that your image isn’t popping up where you don’t want it.
When you test, you’ll either receive an Accepted or Blocked message, and you can edit accordingly.
URL Parameters
Google themselves recommend using this tool sparingly, as an incorrect URL parameter can negatively impact how your site is crawled.
You can read more about how to properly use URL parameters from Google.
When you do use them, this tool will help you keep tabs on their performance and make sure they’re not pointing Googlebot in the wrong direction.
Conclusion
Google Search Console can give you powerful insights into how your site performs, as well as what you can do to keep Google’s attention. Once you have the basics down, learn how to use GSC data to increase your traffic by 28 percent or more.
Do you use Google Search Console? What areas do you find most useful? Please share your thoughts in the comments below, and happy data analyzing!
via https://AiUpNow.com March 24, 2021 at 01:17PM by Neil Patel, Khareem Sudlow,
