I’m often asked to project pay-per-click costs and revenue. The task is challenging owing to variables such as historical data, trends, competitors, and, critically, unforeseen factors.
Nonetheless, here’s my approach.
Historical Data
Reviewing past data is my first step in assembling projections. The static numbers are helpful, but the real value is the trends. Say I’m projecting costs and revenue for the first six months of 2024. Here are the spend, revenue, and return on ad spend for the first six months of the previous three years.
| January | February | March | April | May | June | |
|---|---|---|---|---|---|---|
| Spend: 2023 | $40,000 | $39,000 | $42,000 | $55,000 | $59,000 | $63,000 |
| Spend: 2022 | $37,000 | $38,000 | $40,000 | $48,000 | $52,000 | $54,900 |
| Spend: 2021 | $38,000 | $38,500 | $39,000 | $46,000 | $48,000 | $51,000 |
| Revenue: 2023 | $83,000 | $79,500 | $88,500 | $135,000 | $145,000 | $156,000 |
| Revenue: 2022 | $74,000 | $81,000 | $81,000 | $107,000 | $122,000 | $130,000 |
| Revenue: 2021 | $60,000 | $63,500 | $82,100 | $101,000 | $110,000 | $115,000 |
| ROAS: 2023 | 107.50% | 103.85% | 110.71% | 145.45% | 145.76% | 147.62% |
| ROAS: 2022 | 100.00% | 113.16% | 102.50% | 122.92% | 134.62% | 136.79% |
| ROAS: 2021 | 57.89% | 64.94% | 110.51% | 119.57% | 129.17% | 125.49% |
Note the trends:
- Spend, revenue, and ROAS increase significantly from Q1 to Q2.
- Spend and revenue have generally increased each year.
- Spend and revenue tend to increase each month of Q2.
After reviewing these numbers, I’ll look at account activity to put them into context. Rising costs make sense for more campaigns and keywords — additional coverage requires more budget. Conversely, consistent campaigns and keywords could still result in higher costs per click. Google confirmed during its recent antitrust trial that it inflates CPCs.
Keyword Planner
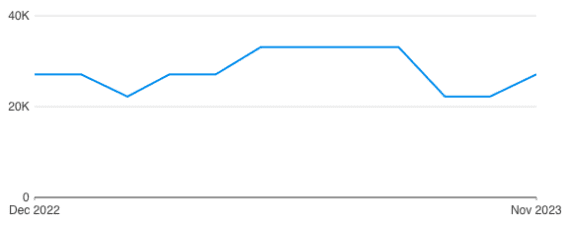
Google’s Keyword Planner provides search volume and cost by keyword for the previous 12 and 24 months. For example, the keyword “roof racks” averaged 27,100 monthly searches last year. Searches slowed in the winter months, picked up in the summer, decreased in the fall, and rose heading into the holidays.

Searches for the keyword “roof racks” slowed in the winter months, picked up in the summer, decreased in the fall, and rose heading into the holidays.
The tool also estimates top-of-page bids, low and high. I look only at the high range since I presume costs will increase. For “roof racks,” the high top-of-page bid estimate is $3.22. Thus the monthly cost for that keyword is:
27,100 searches * $3.22 = $87,262
A monthly cost of $87,262 could be an entire ad budget, not just a single keyword! Luckily, the number is a mirage. It doesn’t consider bid strategy, conversion choices, and negative keywords.
A more accurate projection is in the “Forecast” section, which includes bid strategy and match type but not, notably, ROAS or cost-per-acquisition targets. Thus a “maximize conversions” bid strategy will show a higher cost without those targets.
Google’s “Forecast” uses historical search data, bid competition, traffic, and ad interactions. Here is the projection, below, for “roof racks” and related keywords with a maximize conversions bid strategy over the next year.

Google’s “Forecast” uses historical search data, bid competition, traffic, and ad interactions. This example is for the keyword “roof racks.”
Again, the numbers are estimates, an educated guess. A similar tool, “Performance Planner,” projects existing campaigns.
Final Plans
Having reviewed historical and forecast data, I can create the projections. I typically provide “mild” and “aggressive” options to help clients visualize potential revenue from a higher spend. I sometimes project in more detail, such as by account or initiative.
I’ll start with a conservative “mild” plan and focus closely on goals while accounting for likely higher costs.
Here’s an example. The client aims to increase monthly revenue by 10% while keeping target ROAS within 5% of 2023 performance. The January 2023 metrics were:
- Spend: $40,000
- Revenue: $83,000
- ROAS: 107.50%
A 10% revenue increase would be $91,300, and the ROAS can be no lower than 102.13% (5% less than 2023). A spend of $45,000 will yield a 102.89% ROAS:
($91,300 – $45,000) / $45,000 = 102.89%
Adding $5,000 to the January 2024 budget is a 12.5% increase over January 2023 — for a 10% revenue gain and a 4.29% lower ROAS. The projections presume CPC increases with a minimum (5%) ROAS loss.
The “aggressive” plan typically focuses on customer acquisition — additional revenue from higher spend — not ROAS. I’ll likely use Google’s projections, which are aggressive by default, combined with realistic adjustments, such as a client’s risk level and max budget.
Continuing the example, Google’s projections show a $60,000 spend in January 2024, a 50% increase from last year. Achieving a ROAS at least 96.76% (10% less than last year’s) would result in a 42.2% increase in revenue, to $118,056.
($118,056 – $60,000) / $60,000 = 96.76%
Forecasting costs and revenue from Google Ads is not an exact science considering all the variables. But it’s helpful to set goals and expectations for advertisers.
via https://www.aiupnow.com
Matthew Umbro, Khareem Sudlow
